Monte Carlo Projections
Parametric Gaussian Monte Carlo, 100–1,000 runs. Random returns are drawn around the expected return you enter. Paths are generated, not pulled from a historical tape.
cFIREsim and FIRECalc sit in the same family: historical overlapping-cycle / sequence backtests. They walk your spending plan through real past market years, start year after start year, and report how often the plan would have lasted.
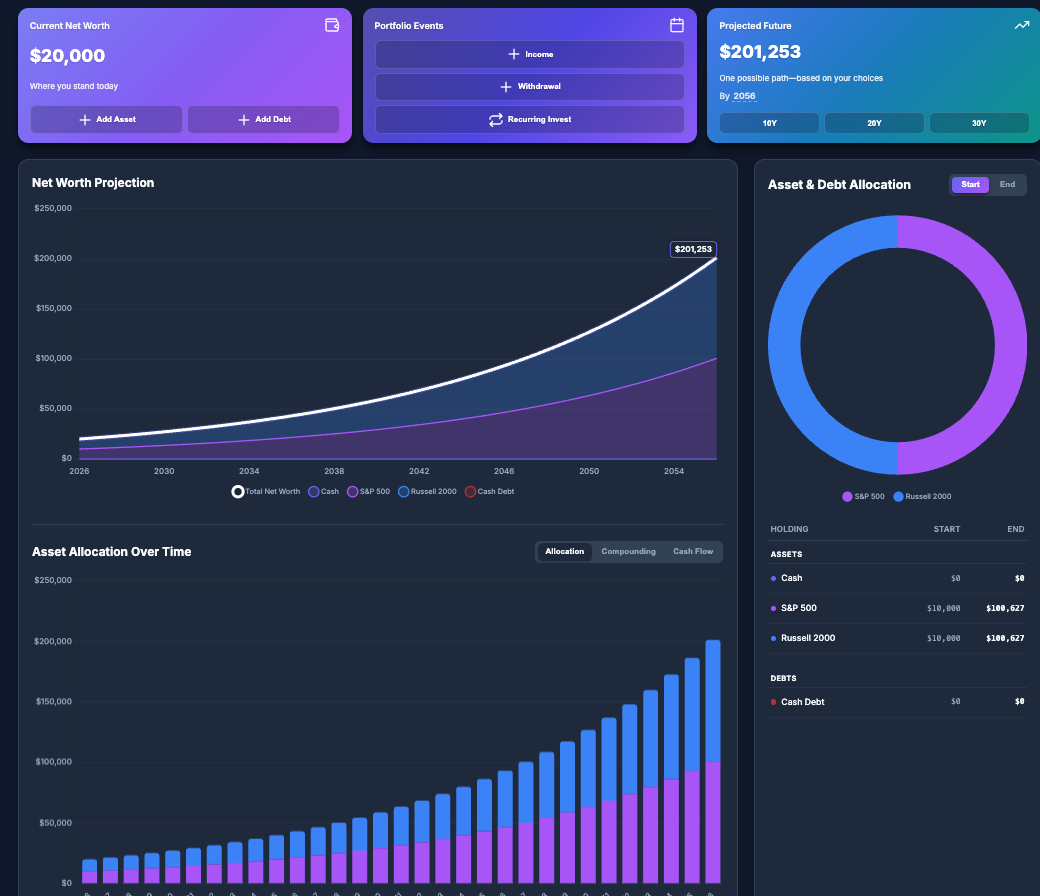
My Projection Calculator does a different job. We run parametric Gaussian Monte Carlo (100–1,000 runs), plus Coast FIRE, crash-year sequence-of-returns tests, what-if sliders, and CSV/Excel/share links. We do not replay history.
Both approaches help you plan for retirement and financial independence. They are not the same test. Facts below were accessed 2026-08-31.
Important: My Projection Calculator is not a full replacement for cFIREsim or FIRECalc. Those two tools backtest a plan against overlapping historical market cycles. We do not. We offer a focused, free, no-signup subset: parametric Monte Carlo, FIRE/SWR, Coast FIRE, a user-chosen crash-year stress test, what-if sliders, and CSV/Excel/share links. If you need historical sequence replay, use cFIREsim or FIRECalc.
FIREproof is a different product. The cFIREsim homepage may show a "Monte Carlo" banner. That banner is a FIREproof advertisement, not a cFIREsim feature. Never attribute FIREproof's tax modeling, Roth optimizer, or Monte Carlo to cFIREsim. cFIREsim is not a Monte Carlo tool.
| Feature | My Projection Calculator | cFIREsim | FIRECalc |
|---|---|---|---|
| Price | Free, no signup | Free, no login. Donations optional. No paid calculator tier. | Free core. Donations. Optional supporter login. (No dollar amount stated.) |
| Account required | No | No | Optional supporter login. Not required for the core calculator. |
| Simulation method | Parametric Gaussian Monte Carlo, 100–1,000 runs | Historical overlapping cycles. Shiller data, 1871–present. Header on the site: "Most Recent Data: Aug. 1, 2026." | Historical overlapping cycles, 1871 through 1/1/2026. Site line: "Data updated on April 17, 2026 with data thru 1/1/2026." Mixed-asset since 1927. Optional random mean+SD mode exists; it is not named Monte Carlo, and we do not cite a run count. |
| Historical backtesting | No | Yes | Yes |
| Parametric Monte Carlo | Yes | No | No |
| Net worth projections | Yes, 1–60 years | No net-worth dashboard | Cycle chart is not a live net-worth dashboard |
| FIRE / SWR | Yes | Yes (historical cycle success rate) | Yes (Trinity/SWR explicit) |
| Coast FIRE | Yes | No | No |
| Tax-aware projections | No | No | No. Ignores taxable vs nontaxable. |
| Roth conversion modeling | No | No | No |
| Social Security / pensions | No SS optimization | SS + spouse, pensions | Two SS streams, up to 3 pensions |
| Medicare | No | No | No |
| Sequence of returns | Crash-year test: you choose the year and magnitude. Not historical replay. | Historical overlapping-cycle replay | Historical overlapping-cycle replay. No crash-year slider. |
| What-if sliders | Yes | Input is one giant form | Not a crash-year slider / what-if slider tool |
| Extra market / spending inputs | — | Kitco gold. VPW, Guyton-Klinger, and other spending methods. | — |
| Export | CSV / Excel | The site documents a CSV of every cycle. We did not re-test a sim. | Spreadsheet/Excel for 30-year Investigate terms only. Not a general CSV. |
| Shareable links | Yes | The site documents bookmarkable output UUID links. We did not re-test a sim. | No documented share links claimed here. |
| Bank linking | No | No | No |
cFIREsim's interface is one giant form. That is a plain description of the layout, not a knock. There is a lot on one page.
The best tool depends on the question. Historical cycle replay and parametric Monte Carlo answer different ones. Neither is "better."
You can use more than one. Many people run a parametric plan and a historical-cycle plan. When the two views disagree, that disagreement is information — usually the expected return you typed, or a historical window that includes a nasty starting year.
Everything below is included free, with no signup.
Parametric Gaussian Monte Carlo, 100–1,000 runs. Random returns are drawn around the expected return you enter. Paths are generated, not pulled from a historical tape.
FIRE / safe withdrawal rate on the same free, no-signup terms. This is not a historical success-rate table. It does not replay cFIREsim or FIRECalc cycles.
Find out whether you have already saved enough to coast to retirement without further contributions. cFIREsim and FIRECalc do not offer Coast FIRE.
Project net worth over 1–60 years. This is a projection from your inputs, not a live linked-account dashboard. We do not link banks.
Test a crash in a year you choose, at a magnitude you choose. That is not historical replay. It is not "what if I retired in 1929." It is "what if a crash of this size hits in this year of my plan."
Move the sliders, export CSV/Excel, and share a link to the result. Free, no signup.
We do not do: tax, Roth conversions, Social Security optimization, Medicare, historical backtesting, or bank linking.
cFIREsim and FIRECalc are the historical overlapping-cycle pair. We are the parametric side.
My Projection Calculator generates random annual returns from a Gaussian distribution centered on the expected return you type. Each of the 100–1,000 runs is a statistically generated path. 1929 does not walk into the model as a sequence. You can test any expected return. The method does not assume the future copies the past.
These tools replay actual historical market sequences through your plan — start in 1871, then 1872, and so on, for as many complete cycles as the dataset allows. That is sequence backtesting. It captures real crash-and-recovery paths and fat-tail years that actually happened, in the order they happened.
cFIREsim uses Shiller data from 1871–present (header accessed 2026-08-31: "Most Recent Data: Aug. 1, 2026."). FIRECalc uses historical data 1871 through 1/1/2026, with mixed-asset data since 1927 (site: "Data updated on April 17, 2026 with data thru 1/1/2026."). FIRECalc also has an optional random mean+SD mode — that mode is not named Monte Carlo.
Neither is "better." Historical captures real sequences and fat tails. Parametric lets you test any expected return and does not assume the future copies the past. Use historical when the question is: would this plan have survived the start years in the record? Use parametric when the question is: how does this plan behave around the return I assume? Most people who care about both questions use both kinds of tool.
We offer the parametric half free, with no signup. We are not a historical-cycle engine.
No. My Projection Calculator is not a full replacement for cFIREsim or FIRECalc. Those two are historical overlapping-cycle / sequence backtests. We do not replay Shiller data, FIRECalc cycles, or any other historical market tape. We do not include tax, Roth, Social Security optimization, Medicare, or bank linking. We are a free, no-signup parametric calculator with FIRE/SWR, Coast FIRE, crash-year sequence tests, what-if sliders, and CSV/Excel/share links. Use cFIREsim or FIRECalc when you need historical sequence replay. Use us when you need the parametric subset.
No. We use parametric Gaussian Monte Carlo around the expected return you enter (100–1,000 runs). Crash-year sequence testing is also user-chosen (year and magnitude), not a replay of a real past crash year.
No. cFIREsim is a historical overlapping-cycle backtest. If you see "Monte Carlo" on the cFIREsim homepage, that is a FIREproof advertisement. FIREproof is a different product. Do not attribute FIREproof's tax modeling, Roth optimizer, or Monte Carlo to cFIREsim.
No. FIRECalc's core is historical overlapping cycles. It has an optional random mean+SD mode. That mode is not named Monte Carlo, and we do not treat it as one or cite a run count.
Neither. Historical captures real sequences and fat tails. Parametric lets you test any expected return and does not assume the future copies the past. They answer different questions.
Because the method is different, not because of price. cFIREsim is free (donations optional, no paid calculator tier). FIRECalc's core is free (donations; optional supporter login; we do not invent a price). Use us if you want parametric Monte Carlo, Coast FIRE, what-if sliders, share links, and a crash-year test you specify — without historical replay. Use them if you want overlapping-cycle history.
When you want a free historical stress test: Shiller overlapping cycles from 1871–present, Social Security plus spouse, pensions, Kitco gold, and spending methods such as VPW and Guyton-Klinger. The site documents a CSV of every cycle and bookmarkable output UUID links; we did not re-test a sim.
When you want the classic Trinity/SWR historical backtest, data through 1/1/2026, two Social Security streams, up to three pensions, and (if you want it) the optional random mean+SD mode. Spreadsheet/Excel is for 30-year Investigate terms only. The cycle chart is not a live net-worth dashboard. There is no crash-year slider.
Yes. Free, no signup. The calculators linked on this page do not require an account.
Run a parametric Monte Carlo, a FIRE/SWR number, or a crash-year stress test — no signup.
No signup. Not a historical backtest. Not a full replacement for cFIREsim or FIRECalc.
Related comparison: My Projection Calculator vs ProjectionLab — another honest comparison. ProjectionLab can do historical backtesting (and tax/Roth work we do not). cFIREsim and FIRECalc remain the historical-cycle pair described on this page. See also: vs Boldin.
Facts on this page were accessed 2026-08-31. This page is a comparison, not financial advice. Historical results are not a forecast. Parametric results are not a forecast.