
Dual-income 30s FIRE
Two earners with a high savings rate — $60k starting, surplus invested monthly. See timeline projections and Monte Carlo-ready numbers.
Load scenarioFree retirement & net worth planning tools. The app starts blank — guided Own → Save → Goal, or skip to the full dashboard.
Not sure where to start? Load one of these hypothetical scenarios in seconds and see what the calculator can do.
Two earners with a high savings rate — $60k starting, surplus invested monthly. See timeline projections and Monte Carlo-ready numbers.
Load scenarioEarly-career teacher building toward Coast FIRE — surplus goes to 403(b). Pairs well with the Coast FIRE Calculator.
Load scenarioManaging mortgage and student debt on one timeline — surplus funds retirement after expenses. Opens as its own named plan you can edit.
Load scenarioNo paycheck — will $7,200/mo spending last 40 years? Pairs well with the FIRE SWR Calculator.
Load scenarioStarted in early 40s but saving aggressively — high savings rate builds toward $1.4M in 13 years.
Load scenarioHigh earners with ~$138k/year spending and a $2.5M target. Pairs well with Lean vs Fat FIRE.
Load scenarioThese are hypothetical examples for demonstration purposes, not financial advice.
Six core tools working together to give you a complete picture of your financial future. No black boxes. No account required to get started.
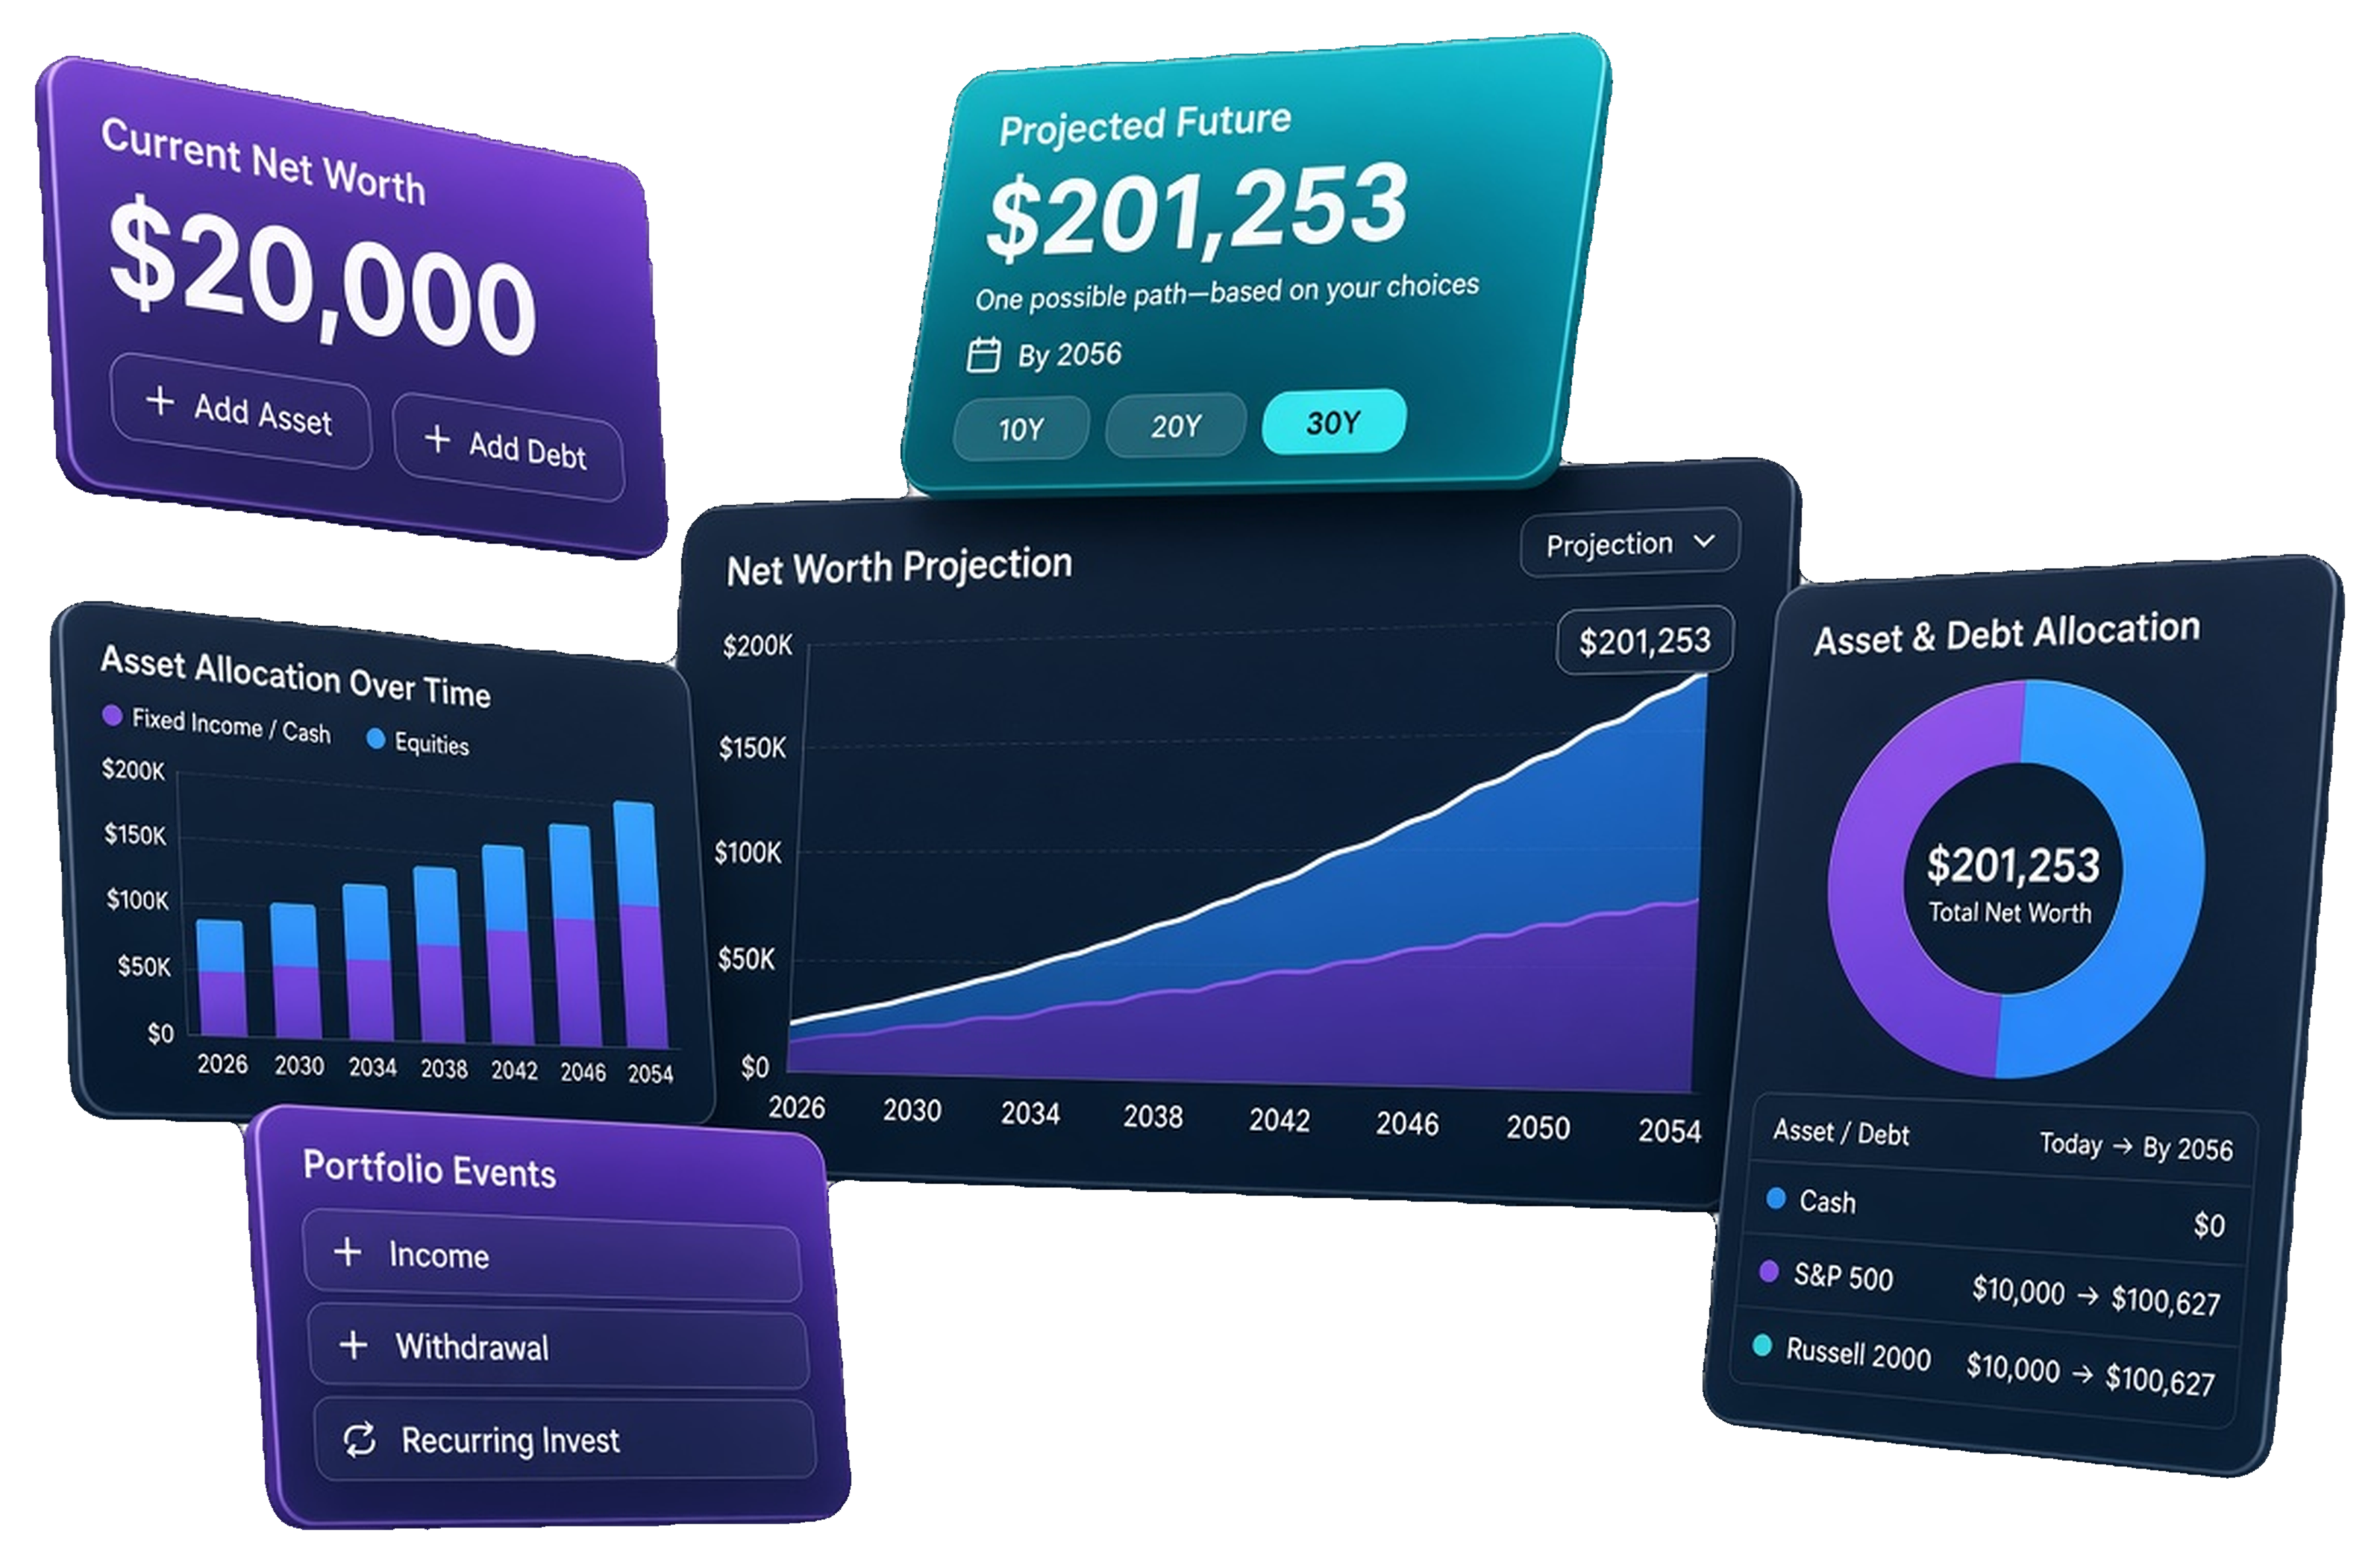
Interactive line charts projecting your wealth over 1–60 years, with inflation-adjusted values and year-by-year breakdowns.
Probabilistic modeling with 100–1,000 parametric iterations to show best case, worst case, and your probability of reaching financial goals.
Model stocks, bonds, real estate, crypto, cash, and loans — each with custom return rates and target allocation rebalancing.
One-time or recurring income, expenses, transfers, and withdrawals. Simulate bonuses, home purchases, or retirement drawdowns.
Real-time sliders for market performance and monthly savings. Lock a baseline and compare experimental changes side by side.
Download projections as CSV or Excel, import/export JSON backups, or generate a shareable link with your scenario encoded.
Dive deeper with calculators built for specific planning needs. All free, no signup required.
See your year-by-year wealth growth with interactive charts. Track stocks, bonds, real estate, crypto, and debt.
Try it nowRun 100–1,000 parametric market paths to see your probability of retirement success with percentile bands.
Try it nowFind out if you've saved enough to coast to retirement without additional contributions.
Try it nowTest how a market crash in year 1, 5, or 10 would affect your retirement portfolio.
Try it nowCalculate your financial independence number using safe withdrawal rate analysis.
Try it nowSee how your money grows with compound interest over time.
Try it nowSee your payment breakdown, interest costs, and payoff timeline.
Try it nowResponsive design and keyboard shortcuts for instant navigation. No menus, no friction.
Full sidebar navigation with interactive charts, KPI cards, and a detailed year-by-year timeline table.
Bottom navigation and card-based layouts designed for planning on the go. Every feature works on your phone.
Generate a unique URL with your projection data encoded. Share with a partner or advisor — no account needed.
Every projection is computed in your browser. No server storage by default. Optional cloud sync is available if you choose to sign in.
New to financial planning? Open the in-app Guide tab (Getting started covers the blank workspace, Own → Save → Goal, named plans, and assumption dollars), or read our Privacy Policy to see exactly how your data is handled. Prefer a short walkthrough? Load a sample and read the chart in about 5 minutes.
Yes. Completely free, no account required, no paywall. Open the calculator — it starts blank — then add your numbers or load a sample to see a projection in minutes.
No. Your data is stored locally in your browser for privacy. You can export to CSV or Excel, back up a named plan as JSON, or generate a shareable link. Optional sign-in enables cloud sync across devices.
No. Opening the app lands you on a blank workspace. Nothing is soft-loaded. Use the guided wizard — What do you own? → What can you save? → What is your goal? — or tap a sample chip under Or pick a sample. You can also Skip to full app. Samples open as separate named plans and are demos you can edit. After load, a banner says you're viewing a demo sample and every field is editable (Dismiss on that banner too).
It is the guided first-result wizard: Own → Save → Goal (What do you own? / What can you save? / What is your goal?) — not the older “Add assets → income → years” strip. You can pick a sample from the chips in the same area, or Skip to full app. After the wizard or Skip, three quick-start bubbles remain: Add asset/debt, Add income/expense, and Add goal. Samples open as separate named plans so existing work is kept. The control to hide the strip is labeled Dismiss. On phones the strip is more compact.
No — picking a sample opens it as a separate named plan and keeps the plan you were already editing. Switch back from Saved plans in the header, or use Export/Share. After a sample loads, a banner reminds you every field is editable so you can turn the demo into your numbers.
On the dashboard, projections can show Today's dollars or Future dollars, depending on whether inflation adjust is on or off. Open the assumption summary details panel to see the return, inflation, and related choices behind the chart. Hypothetical only — not advice.
Yes. Use Plan backup to export or import JSON of the current named plan, generate a Share link (the app explains what the link includes before you copy it), or download projection data as CSV/Excel. Core tools stay free; numbers stay in your browser by default unless you opt into cloud sync.
Yes. Use reset/start over in the app when you want a blank workspace again. Core tools stay free; numbers stay in your browser by default.
Investment growth, net worth projections, retirement readiness, FIRE planning, and financial goals — using Monte Carlo simulations (parametric, 100–1,000 paths), Sequence of Returns stress tests, and interactive what-if sliders. It is a free browser projector, not a full replacement for paid planners.
Yes. The calculator is fully responsive with mobile-optimized navigation, card layouts, and touch-friendly controls on every screen size.
Model your financial future in minutes — no sign-up, no paywall, free forever.
Launch Projection ToolNo sign-up · Privacy-first · Free forever